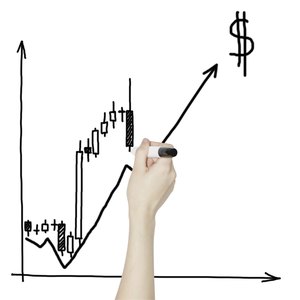
A foreign exchange (Forex) candlestick identifies the high, low, opening and closing prices of a pair of foreign currencies over a specific period – four-hour durations are popular in the Forex market. To use candles effectively, a trader must understand the meaning of the candlestick body and wick shapes and the significance of various patterns made by a sequence of candlesticks.
By interpreting candlestick patterns, such as a candle with a long wick on Forex price charts, a trader tries to predict profitable market entry and exit prices.
Read More: How Does Forex Trading Work?
Long Wick Candlestick Meaning
The basic candlestick shape is a rectangular "candle body" with two vertical "wicks" – one top and one bottom – protruding from the candle body. You draw candles on charts where price is the Y-axis and time is the X-axis. The candle body top and bottom represent a currency pair's opening and closing prices.
If a currency pair closes higher for the period, the body is green; otherwise, it’s red. The tip of a top wick is the pair's high price for the period; the tip of a bottom wick shows the period low. Two long wicks indicate that prices ended away from the period's extremes, not evidence of a strong trend.
Forex Trend Trading
Higher high and higher low prices within a contiguous period signify an uptrend; downtrends are the mirror image. You recognize an uptrend by seeing a series of higher lows and higher highs in succession, while a downtrend is the horizontally flipped image. An uptrend breaks when the current price moves below a previous low, and downtrend reversals see prices break above a previous high.
Traders use trends and trend breaks in sophisticated algorithms that signal when to open or close positions. A short candlestick wick indicates a strong trend because the Forex pair moved close to its extreme for the period. Specifically, a short bottom wick reinforces the downtrend signal from descending candles.
The reverse is true for a short top wick, confirming an uptrend among ascending candles. Conversely, long wicks show that the currency pair settled away from the extremes, evidencing a lack of trend.
Recognizing Trend Trading Signals
A trend trading signal generates when actual prices pierce a moving average band: Buy on an upward penetration of high prices, sell when you fall through the low prices band. The best candlestick patterns help traders recognize trends and reversals, indicating buying and selling opportunities.
Read More: Types of Candlesticks
For example, you can adjust candle body width to signify trading volume – fatter candles indicate high volume, skinny ones show low volume. Technical traders believe that a price trend or reversal is stronger if it occurs on high volume, easily recognized by a fat candle. Candle wick length is a secondary indicator that either reinforces or dilutes the predictive power of price breakouts.
Learn and Practice
Many standard candlestick patterns denote particular trading conditions. For example, the "marubozu" pattern is a tall candlestick (i.e., opening and closing prices separated by a significant distance).
Suppose a red (lower prices), fat (high volume) marubozu candlestick with a long bottom wick (movement away from the lowest price) and no top wick (closes at its high) appears after several downtrend days. In that case, technicians might predict a price reversal following panic selling.
Forex Trading Can Be Treacherous
Many professionals advise not to attempt Forex trading until you are very comfortable with all the jargon and understand how currency prices move. The best way to practice and hone your skills is to open a demonstration account with a Forex broker, which is an account that only simulates the trades you enter – you spend no actual money.
Keep track of your results and only go live when your strategy provides consistent winnings. Another common piece of trader wisdom: If you don't know the amount at risk, don't trade!
Read More: How to Join FOREX
References
Writer Bio
Eric Bank is a senior business, finance and real estate writer, freelancing since 2002. He has written thousands of articles about business, finance, insurance, real estate, investing, annuities, taxes, credit repair, accounting and student loans. Eric writes articles, blogs and SEO-friendly website content for dozens of clients worldwide, including get.com, badcredit.org and valuepenguin.com. Eric holds two Master's Degrees -- in Business Administration and in Finance. His website is ericbank.com.

