

Microsoft Excel can be used to analyze and research stocks by using formulas to determine the future stock price. There are many ways to analyze a stock or company to determine whether it is of interest for an investment. Earnings per share (EPS), cash flow, equity and sales growth rates are values that can be used to analyze a stock, determine if it is worth pursuing and determine a future stock value.
The more data you can accumulate, the more accurate your future value predictions will be. Studying the last ten years of growth will give a good long term average and an accurate future stock value estimate.
By determining the future stock value you can calculate a current stock target price. If you are a conservative investor you may decide to lower your target price by even more. Phil Town recommends in his book "Rule #1" that the target price should be divided in half to determine an even more conservative target price.
Whatever the investing strategy being implemented is, Excel can be used to calculate previous growth of a company and the probable future value of the stock price.
Calculate each growth category separately. Regardless of which growth rate category is to be calculated, Excel uses the same formula.
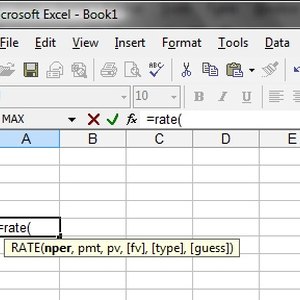
Type into Excel "=rate(". The remainder of the formula requirements will appear on the screen: nper, pmt, pv, [fv], [type], [guess]. As you type in each piece of data, type a comma and the next required element will appear in bold.
"nper" is the number of years. Use the number of years you have data for and subtract one. If you have ten years of data, nper=9.
"pmt" is the number of payments each year. This calculation does not have payments, therefore leave it blank by typing another comma.
"pv" is the beginning number. If the EPS 10 years ago was $1.13, the proper input for the formula would be "-1.13". The negative sign is required to make the formula function correctly. In a rate calculation, you are telling the computer the amount you paid out.
'[fv]" is the ending number of your chosen growth rate category. If the most recent EPS number is $2.20, type in "2.2" and a close parenthesis.
Ignore the [type] and [guess] functions of the formula. They are not required.
The inputted formula should read, "=rate(9,,-1.13,2.2).
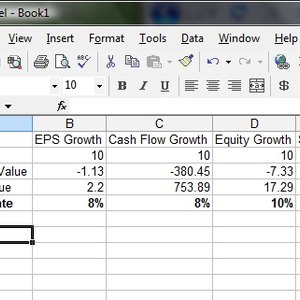
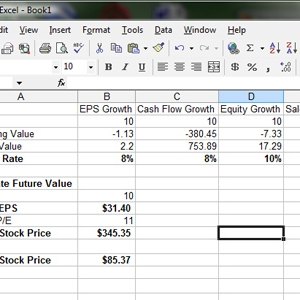
Press the Enter key and Excel will calculate the growth rate for the chosen category in the cell you typed the formula into. In this example, the growth rate is 8%. All growth rate formulas work the same. Use the same formula for all the growth categories. To edit the formula, use the formula bar just below the menu bars.
Performing repetitious tasks with Excel is possible by creating cells to input the data into, having the formula read those cells and immediately recalculate the formula based on the new data, allowing you to quickly research multiple stocks, one right after the other.
For example, in cell A1 type "Years", in cell A2 type "Beginning Value", in cell A3 type "Ending Value", in cell A4 type "Growth Rate". In cell B4 type the formula, "=RATE((B1-1),,B2,B3)". Type the values in B1, B2, and B3 to determine the average growth rate of the company. Excel will immediately calculate the growth rate when any of the three values are changed.
Using the method in Step 1, create a set of formula cells for each of the growth categories EPS, cash flow, equity and sales growth rates.
Calculate future EPS by using the formula, "=FV(rate, nper, pmt, [pv], [type]".
The "rate" is the growth rate determined by using the growth rate formula. "nper" is the number of years into the future that is going to be calculated. Skip "pmt" by inputting a comma. The "[pv]" is the starting value and is input as a negative number. Example: =FV(8%,10,-2.2) gives a future EPS of $31.40.
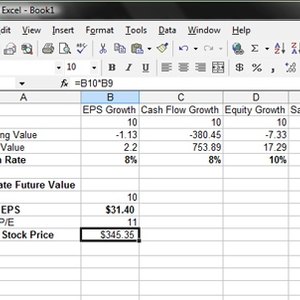
Estimate the future Price to Earnings Ratio (P/E Ratio). Choose another cell and multiply the future P/E by the future EPS. Example: "=31.40*17" will give you the future stock price of $345.35.
Determine what price you will pay for the stock today by using your minimum acceptable rate of return on your investment. If 15% is your minimum acceptable rate of return use the following formula: "=PV(15%,nper,pmt,[fv],[type])".
Rate is 15%. The nper is the number of years from the future buyback. Skip pmt by inserting a comma. The [fv] is the future stock price. In the above example it is $470.41. The [fv] is always entered as a negative number. The formula should look like this: "=PV(15%,10,,-345.35)" and equals $85.37. This is your basic target buy price. It can be manipulated and lowered based on individual risk tolerance.
Warnings
The information in this article is for general information and reference. Investing is personal and different for every individual based on risk tolerance.
Investing in the stock market has inherent risks. Develop a trading strategy and plan that meets your risk tolerance.
Warnings
- The information in this article is for general information and reference. Investing is personal and different for every individual based on risk tolerance. Investing in the stock market has inherent risks. Develop a trading strategy and plan that meets your risk tolerance.
Writer Bio
Eric Duncan is a military veteran and a professional in the safety, travel and aviation industries. Duncan has been writing since 2002 for magazines, newspapers, local business literature and on such websites as Singletraks.com. He has earned his Bachelor of Science in professional aeronautics and his Master of Business Administration.