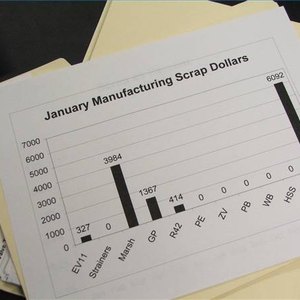
Creating a money graph is a great way to determine how much money has been spent on certain items. The graph can be used as a financial tool for you in an effort to help you eliminate some of the unnecessary items you purchase. Viewing the chart after each month will allow you to see if you have any extra money for purchases after you have bought your family's essentials.
Open up a new, blank document in Microsoft Word on your computer.
Click "Insert" from the menu bar, then "Object" and "Create New."
A box will pop up that says "Object Type." Here you will click "Microsoft Graph Chart." Then click "OK."
A data sheet will pop open, and you will need to type in the proper information, starting by entering the title in the first row (examples: clothing, food, housing, misc).
Look through your receipts and type in the numbers that correspond with the title. For instance, if you spent $100 at a grocery store simply type in "100." If you spent $50 the next week, key in "50." All of these numbers will add up, and you will be able to determine exactly what you are spending your money on.
When you are finished entering in all of your information, click "File" and "Save as.' A box will pop up, and here you can type in the month that you have been recording (example: May 2009). After you have keyed in your title, click "OK."
If you wish to print your graph for future reference, simply go to "File" in the menu bar and then "Print."
Writer Bio
Lindsey Lewandowski has enjoyed writing since she was old enough to know how. She kept a daily journal and would write everything from poems and song lyrics to the things she has done throughout the day. Lewandowski is now older and still loves to write and has contributed to sites such as Examiner and eHow.

